
Note for chapter 1 Data Visualization (数据可视化)
Vacabulary for this chapter
left skewed 左倾斜
symmetric 对称
right skewed 右倾斜
outliers 异常值,极端值
Qualitative Variables and Quantitative Variables
Categorical (qualitative) variables 属性变量: individuals are placed into groups or categories
Quantitative variables 定量变量: numerical values where arithmetic operations such as adding and averaging make sense.
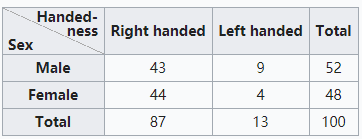
Contingency Table (列联表)
Sometimes, contingency tables are used to display the frequency distribution of multiple variables.
Example:
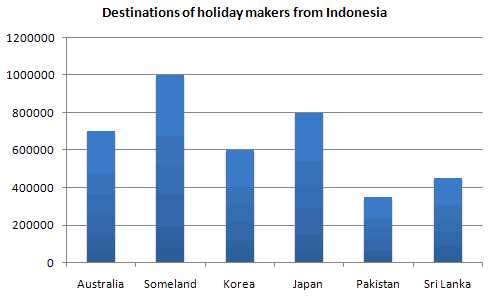
Bar Chart (条形图)
Bar charts are preferred as:
- It is easier to draw (especially when you need to do it by hand)
- It is easier to compare the size of various categories (especially when the difference is not that significant)
- It can be used if your categories do not add up to “a whole”
- You can label the name and value of each categories (especially if you have many) without making the graph looking too messy.
Example:
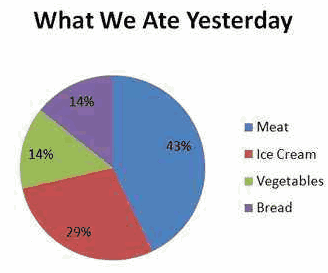
Pie Chart (饼图)
Pie chart is preferred when:
- Making comparison for 2~3 different data points with very different amounts of information
- Show relationship of parts out of a whole.
Example:
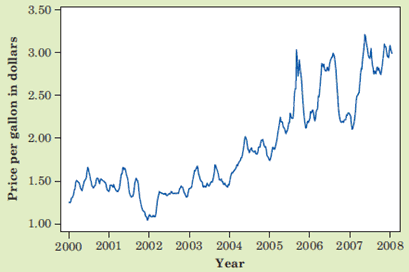
Line Graph (线图)
Line graph is useful to display the change of values over time.
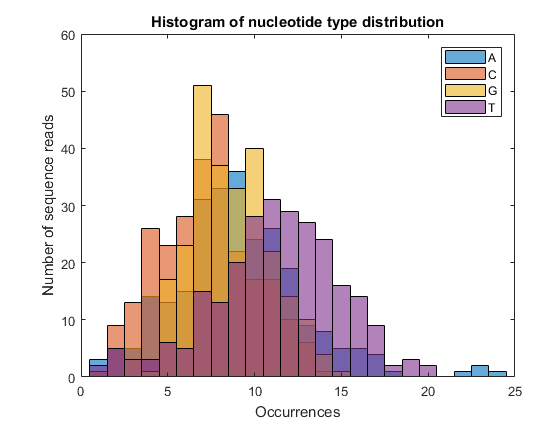
Histogram (直方图)
Histogram shows the frequency distribution of values, looks similar as bar chart.
- The horizontal axis is the numerical number line
- The non-overlapping classes of same width are represented by rectangles
- Heights (hence the total area) of each rectangle represents the frequency/counts in each particular class.
- The overall distribution of data is nicely shown if properly drawn.
Example:
Bar Chart 和 Histogram 的区别:
Bar Chart 的横轴是属性变量(qualitative variables),Histogram 的横轴是数字区间(Quantitative variables)
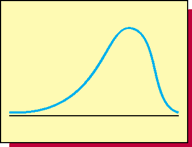
三种形态:
-
Left Skewed
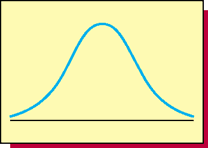
-
Symmetric
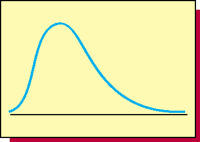
-
Right Skewed
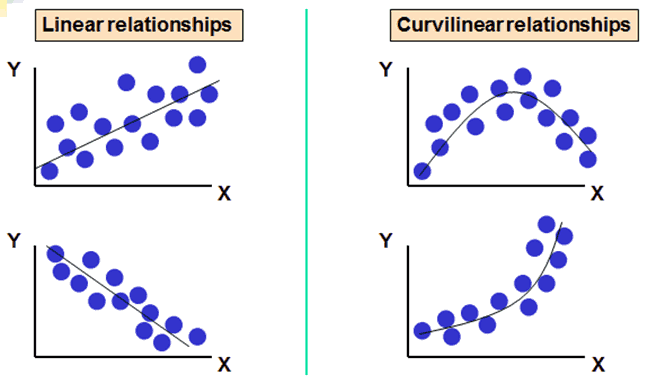
Scatter plot (散点图)
Scatter plot helps to reveal the relationship between two variables.
Boxplot (盒形图)
Boxplot displays the position of the minimum, maximum and outlier values, as well as the first, second and third quartiles.
Boxplots can be easily put side-by-side for comparison.
For a set of measurements arranged in increasing order, the percentile(百分位点) is a value such that p percent of the measurements fall at or below the value and (100-p) percent of the measurements fall at or above the value
- The first quartile is the percentile
- The second quartile (or median) is the percentile
- The third quartile is the percentile
- The interquartile range (IQR 四分位距) is -
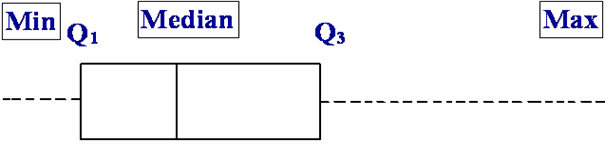
The box plots the:
- first quartile, ;
- median, ;
- third quartile,
Limits, located 1.5 x IQR away from the quartiles:
- lower limit= – (1.5 x IQR)
- upper limit= + (1.5 x IQR)
The whiskers: 2 dashed lines
- A dashed line drawn from the box below Q1 down to the smallest measurement between the lower and upper limits
- Another dashed line drawn from the box above Q3 up to the largest measurement between the lower and upper limits
Outliers lie beyond the limits of the box-and-whiskers plot. Outliers are measurements that are very different from most of the other measurements. Plot each outlier using the symbol *.
Example:
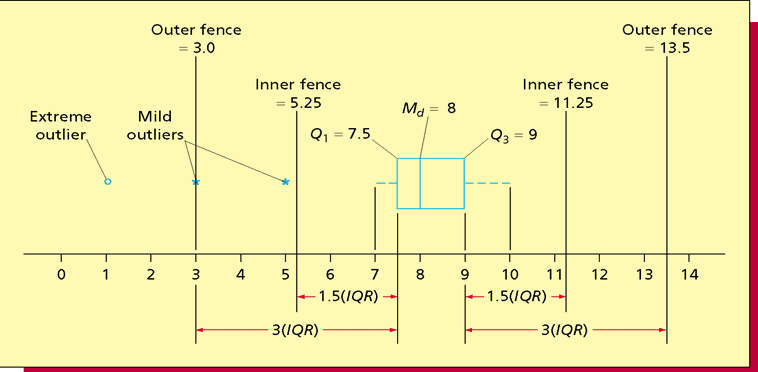
The box plots the:
- first quartile, ;
- median, ;
- third quartile,
- inner fences, located 1.5IQR away from the quartiles:
- = – (1.5 x IQR)
- = + (1.5 x IQR)
- outer fences, located 3IQR away from the quartiles:
- = – (3 x IQR)
- = + (3 x IQR)
- The “whiskers” are dashed lines that plot the range of the data
- A dashed line drawn from the box below down to the smallest measurement
- Another dashed line drawn from the box above up to the largest measurement
- Note: , , , the smallest value, and the largest value are sometimes referred to as the five number summary
Outliers lie beyond the fences of the box-and-whiskers plot
- Measurements between the inner and outer fences are mild outliers (轻微异常)
- Measurements beyond the outer fences are severe outliers (严重异常)
0 条评论
来做第一个留言的人吧!